Comprehensive analysis on structured products
Register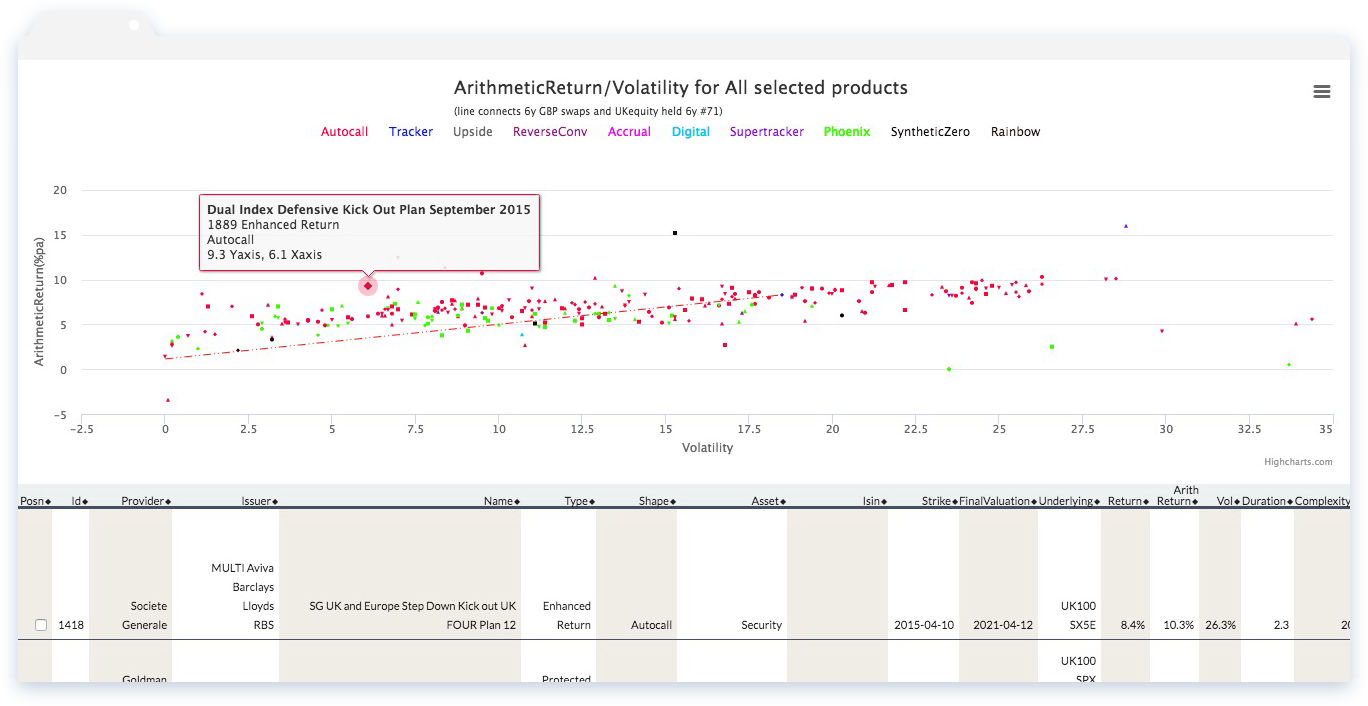
Our products
Product analysis
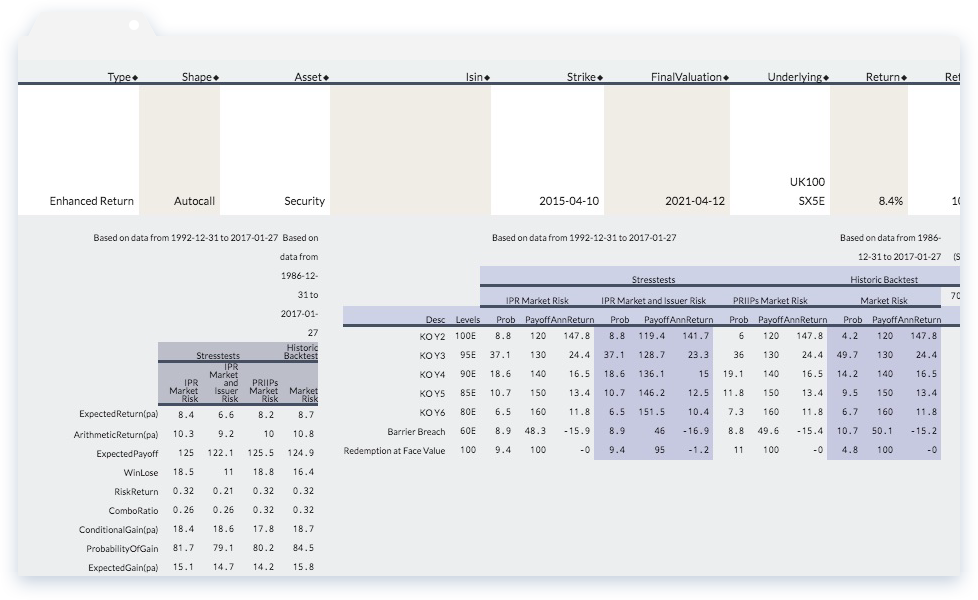
Easy-to-understand, powerful analysis – updated every week. We offer an extensive range of measures:
- Return – CAGR, arithmetic, chance and amount of gains;
- Risk – volatility, chance and amount of loss, various VaR and conditional VaR measures;
- Time – expected duration, chance of early maturity.
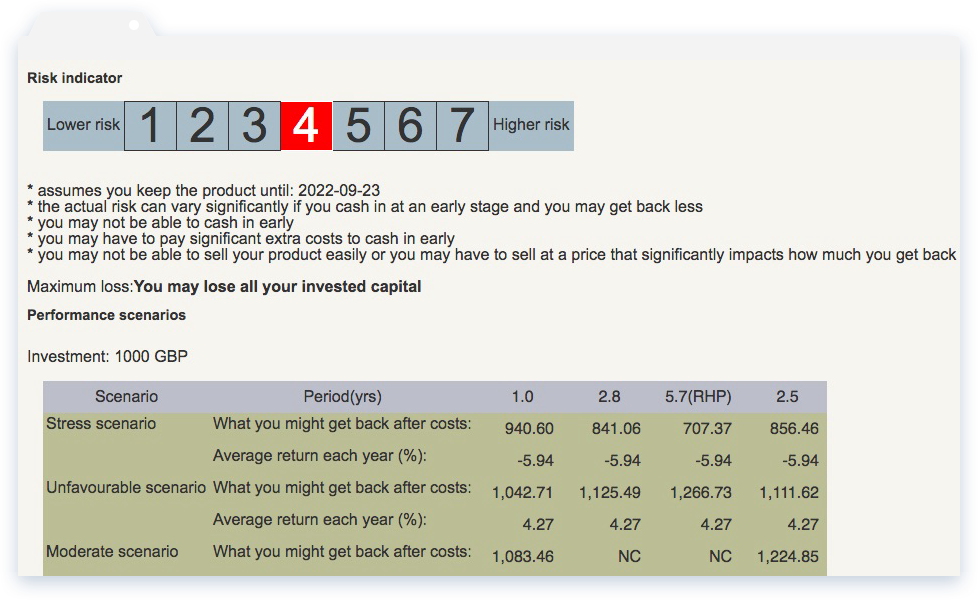
PRIIPs analysis
PRIIPs risk measures, updated every week.
Generate PRIIPs reports with one easy click.
Product listing
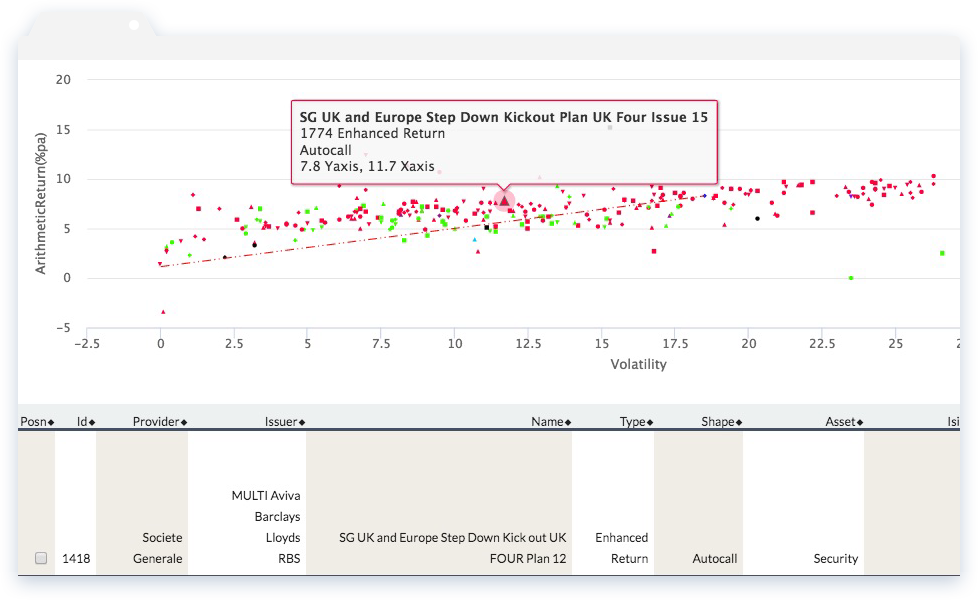
Whole of market – rank the entire market with your chosen performance criteria. With over 2,500 live products you can:
- Search – any combination of criteria such as Issuer, Manufacturer, Underlyings, Volatility, Shape, etc;
- Graph – all products meeting your search criteria are plotted on a scatter graph, and you can choose the axes;
- Sort – using any listing columns, such as Return, Volatility and so on.
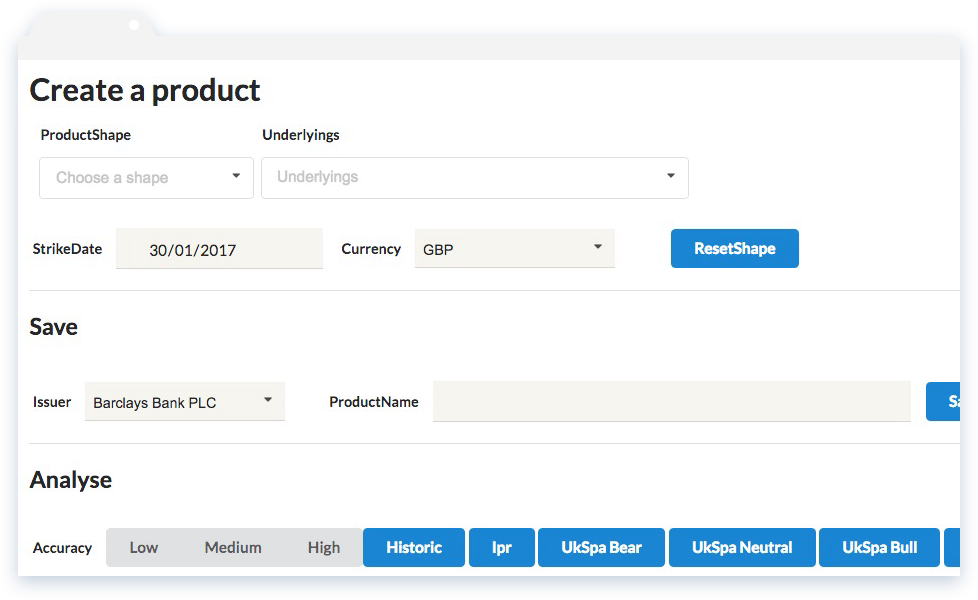
Product upload
Load and test your product ideas, or real products. You can upload product ideas (or existing market products, in the unlikely event we do not already have them)
- User-friendly – intuitive interface using a range of typical shapes;
- Complex – advanced interface for more complex products;
- Upload – use our Excel template to upload any product.
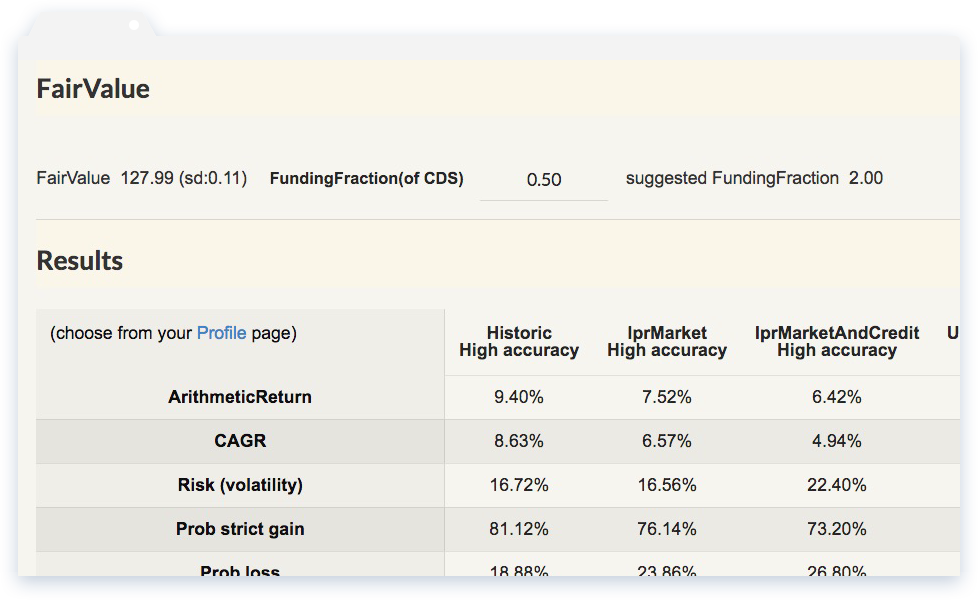
Fair values
Quickly price most products. Single-click fair value of any product based on the main equity indices:
- Funding – we constantly estimate issuer funding rates (implied from existing public products), which can then be used in the fair value calculations;
- Shape – we suggest a funding fraction based on estimated issuer funding (above) and product shape.
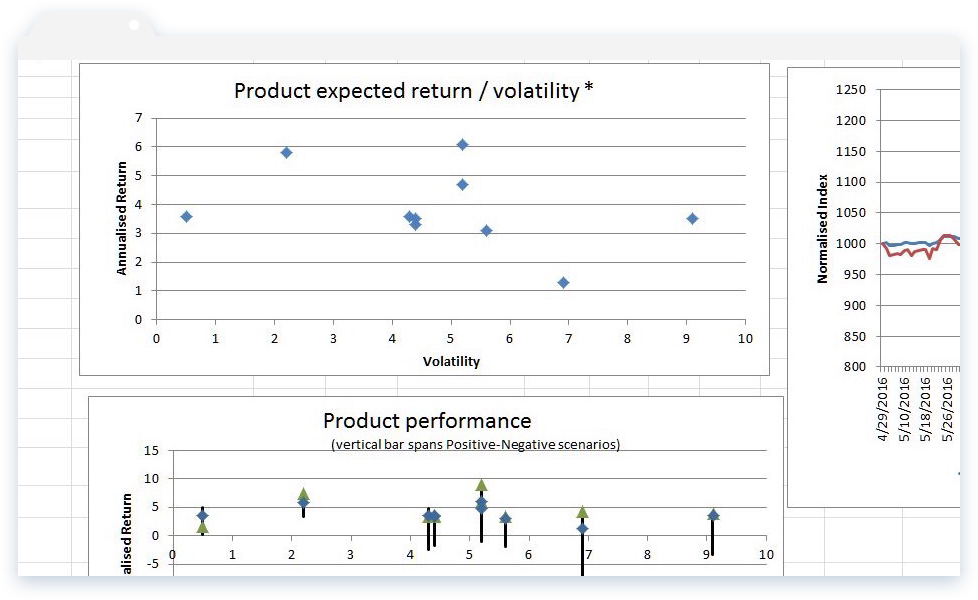
Portfolio analysis
Assemble and evaluate portfolios of products. We have a range of portfolio solutions:
- Single-click choice of products – a portfolio weighting can also be applied;
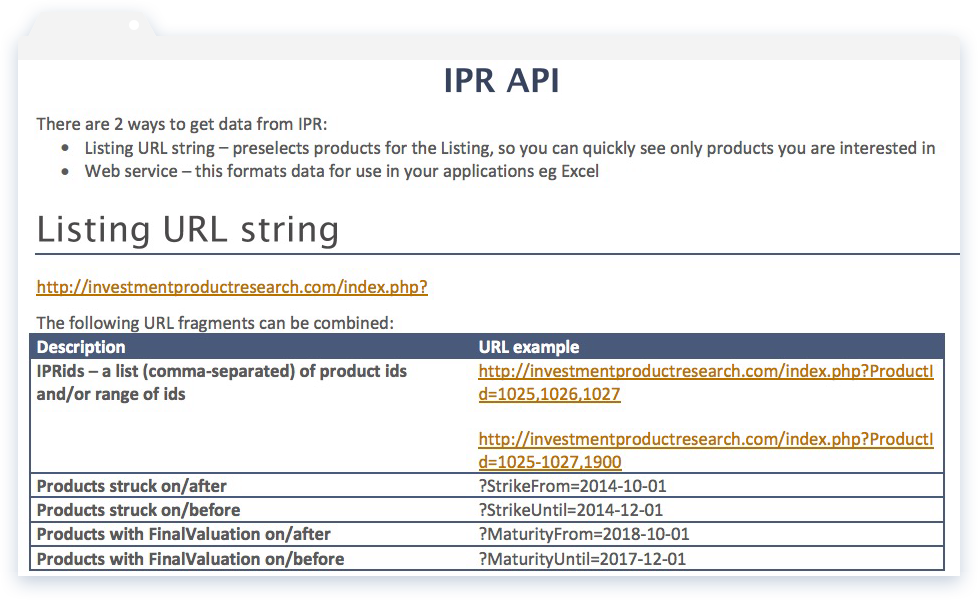
- API reporting – we offer a configurable API for digital access of all product analysis;
- Excel reporting – we offer a configurable Excel sheet for digital access to portfolio performance.
Access analysis
API access to all our product analysis. We offer a comprehensive set of API end-points so you can get digital access to:
- API reporting – we offer a configurable API for digital access of all product analysis;
- API PRIIPs reports – available on any product so you can embed them in your workflows;
- Excel reporting – we offer a configurable Excel sheet for digital access to portfolio performance.
Why IPR
Independent
We are independent of any issuer or product Manufacturer, so you can trust that our analysis is 100% impartial.
Unequalled analysis
We have more types of analysis than anyone else!
Apart from our level-playing-field analyses, you can analyse products using user-defined parameters for drift, volatility and correlation.
Transparent analysis
Our analysis approach is powerful yet simple to understand.
No statistical or mathmetical background is needed; all the calculations fully described; and we make no assumptions about the future – there are no subjective inputs.
Continuing analysis
We analyse all products every week, so the analysis is always up-to-date. Product issuers, promoters and investors need to monitor performance continually, throughout product life, reflecting:
- Changing spot levels – bringing barriers closer or further away, and so changing their probability;
- Elapse of time – changing barrier probabilities;
- Market regimes – changes in market volatility can impact barrier probabilities.